Elaborating and improving the Cacophony Mapper
Sep 2019 - ongoing
Creating the hard- and software behind the idea
On the ICU, sounds are the most direct way in which the nurses receive information about the patients. However, there are a lot of problems with the number and loudness of these sounds, as described by Yoon in ‘Noise fatigue in the ICU’ graduation project. There are a lot of sounds, and it is normal that these sounds reach levels of 80dB (which is comparable to a milling machine or truck). It’s not surprising that the sensory system stops reacting to all these sounds and that it gets tired of all the auditory input it receives. To create insight in which types of sounds, and when and where on the ICU these sounds are the most problematic, data needs to be collected about the sounds and the reaction of the nurses to it. For this, I created an app.
You cannot create a good solution, without having an elaborate understanding of the problem. Therefore, I focused on collecting and visualizing all information around the problem.
Deanne Spek
How does it work?
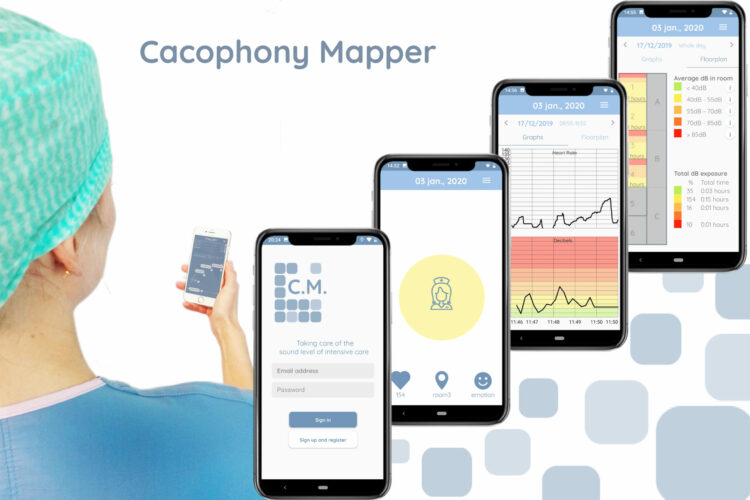
An app is developed in which connects different types of hardware, collects their information and combines it into useful data:
- Sound is collected via a lev microphone, connected to the collar of the nurse. All sounds are transformed in such a way that they are not recognizable (the sounds are transformed into numbers). The collected sounds are classified by a model that is built by machine learning. Currently, we are using the model of Yoon, but I am working on an improved model. In this way, we know if there is an alarm, speech, footsteps, machinery etc.
- Stress and fatigue are collected via a quick ‘survey’ in the app and via collecting the heart rate of the nurse.
- The location of the nurse is determined by placing beacons inside the ICU. We do not receive the exact location, but the ICU is divided in zones and rooms.
- With this information, it is possible to answer all types of questions. Which sounds are most stressful? How much noise does every nurse hear, and how much do they contribute to? Where on the ICU are sounds the most problematic? Which sounds are not reacted to at all? Etcetera. Inside the app, there is already a page which visualizes some combinations of the data. Two examples: you can see your heart rate connected with the decibels over time, and there is a heatmap showing the amount of time you received sound from a certain dB-level.